
Graph and Progress Tracking
WPComplete Pro offers multiple ways to display student progress visually or as text. These tools help learners see how far they’ve come in a course and support more personalized, interactive learning experiences.
There are two types of progress tracking:
- Text-based shortcodes: Show progress as a percentage or ratio
- Visual shortcodes: Display progress as a bar or circular graph
All styles can be customized in the WPComplete > Settings panel to match the design of your site.
Note: If progress visuals are not updating due to caching, consider using the asynchronous setting. This feature is currently in beta:
[wpc_progress_percentage async="true"]
Text-Based Progress
Percentage Completed
To display the percentage of content completed across all courses:
[wpc_progress_percentage]

To show progress for a specific course (replace "Course-Name" with the actual course title):
[wpc_progress_percentage course="Course-Name"]
To show progress across all courses:
[wpc_progress_percentage course="all"]
To track progress for multiple courses, use a comma-separated list:
[wpc_progress_percentage course="Coursename1, Coursename2, Coursename3"]
Ratio of Completed to Total Lessons
To display the number of completed lessons versus the total number of lessons:
[wpc_progress_in_ratio]

For a specific course:
[wpc_progress_in_ratio course="Course-Name"]
Visual Progress Tracking
WPComplete Pro includes two stylable visual graph options. Both can be customized in WPComplete > Settings > Graphs.
Bar Graph
To display a horizontal progress bar:
[wpc_progress_bar]
To show the progress bar for a specific course:
[wpc_progress_bar course="Course-Name"]

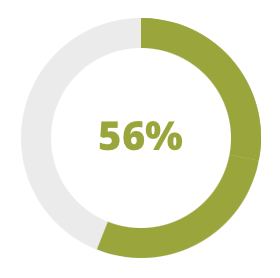
Circle Graph
To display a circular graph of student progress:
[wpc_progress_graph]
To target a specific course with the circular graph:
[wpc_progress_graph course="Course-Name"]
Managing Graph Settings (Version 2.9+ and Above)
If the bar or circle graph features are not needed, WPComplete allows you to disable them to reduce code load and improve performance.
To turn off graph code:
- Go to Settings > WPComplete > Graphs
- Select “NONE” for either the Bar or Radial graph options
If graphs are needed later, return to this setting and choose “Classic” to re-enable them.
Conclusion
WPComplete Pro provides flexible options for showing student progress using shortcodes. Whether using text-based stats or visual graphs, these tools help learners track their achievements and stay motivated throughout a course. Site owners can configure and style these visuals in the WPComplete settings to match their content and design goals.
